
Navigating the Local Real Estate Market in a Shifting Economy
The real estate journey can feel overwhelming, especially in today’s shifting market. As of July 2026, national headlines often paint a broad picture. However, the true story of housing—whether buying or renting—unfolds at the local level. What’s happening in your neighborhood might be very different from the national average.
We understand that making informed decisions requires deep local insight. This guide is designed to empower you. We will help you cut through the noise. We’ll explore current trends and predictions for local real estate. We will also look at how interest rates and affordability affect you. Our focus is on providing actionable strategies. These will help you succeed as a buyer or renter. We will show you how to leverage local data and knowledge. This includes insights from a data-driven real estate platform. We want you to feel confident. We aim to help you navigate your unique local market with clarity and purpose.
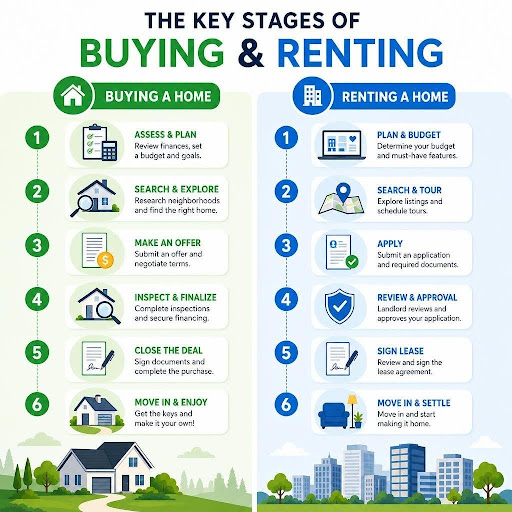
As we move through July 2026, the real estate landscape continues to evolve, presenting a complex mix of opportunities and challenges. Macroeconomic indicators, such as inflation and employment rates, are influencing monetary policy, which in turn dictates mortgage rates. Currently, the 30-year fixed-rate mortgage averages around 6.55%, a benchmark that significantly impacts affordability for both buyers and investors. This rate, while elevated compared to the ultra-low rates of previous years, has stabilized somewhat, allowing for a more predictable, albeit competitive, market.
Inventory levels are another critical factor. While some national reports indicate a slight increase in homes for sale, this trend is far from uniform. We’re observing significant regional splits across the country. In some areas, like parts of the Sun Belt, inventory has surged due to overbuilding and climate-related insurance challenges, creating more favorable conditions for buyers. Conversely, many markets in the Midwest and Northeast continue to grapple with limited supply, keeping competition robust.
Consider Michigan, where the average home value is $241,804, reflecting a 5.0% increase over the past year. This growth, while steady, is moderated compared to the rapid appreciation seen during the pandemic. In specific Michigan locales like Traverse City, the median listing price is higher at $439,900, with homes often selling at or above asking price, indicating strong local demand.
Meanwhile, in Nampa, Idaho, the average home value is around $417,000, and properties are going pending in about 11 days. This fast-moving market rewards preparation and decisive action from buyers. In contrast, Las Vegas, Nevada, has experienced a slight year-over-year price dip of 1.3% to $473,875, with inventory increasing to 3.2 months of supply, shifting leverage more towards buyers. This regional divergence highlights why relying solely on national headlines can be misleading; local conditions are paramount. To truly understand the dynamics at play in your specific area, leveraging a robust, data-driven real estate platform can provide invaluable insights, helping you make decisions backed by real-time, localized information.
Identifying Your Local Market Type: Buyer’s vs. Seller’s Markets
Understanding whether your local area is a buyer’s market or a seller’s market is fundamental to developing an effective strategy. This distinction hinges primarily on the concept of “months of supply,” which measures how long it would take for all currently available homes to sell at the current absorption rate.
A balanced market typically has between two to six months of inventory, indicating a relatively even playing field where neither buyers nor sellers have a dominant advantage. However, as of July 2026, many areas are leaning distinctly one way or the other.
In a seller’s market, inventory is low (typically under 4 months), and demand outstrips supply. This leads to increased competition among buyers, often resulting in multiple offers, bidding wars, and homes selling quickly—sometimes above the asking price. Sellers have more leverage, can be less flexible on contingencies, and may receive offers with fewer concessions. For example, in competitive Midwest markets like St. Louis, Missouri, where the average home value is approximately $280,000, more than one in three homes go pending in under seven days.
Conversely, a buyer’s market emerges when there’s an abundance of homes for sale (typically over 5-6 months of supply) and fewer active buyers. In this scenario, buyers gain significant leverage. Homes tend to sit on the market longer, sellers may need to reduce prices, and buyers can negotiate for concessions, repairs, or more favorable terms. Miami, for instance, has seen homes sitting on the market for an average of 104 days, making it a strong buyer’s market where sellers are often more willing to offer incentives.
To identify your local market type, we recommend analyzing several key indicators:
- Months of Supply: Check local real estate reports for this metric.
- Average Days on Market (DOM): Shorter DOM suggests a seller’s market, longer DOM indicates a buyer’s market.
- Sale-to-List Price Ratio: A ratio above 100% (homes selling above asking) points to a seller’s market, while below 100% suggests a buyer’s market.
- Price Reductions: An increasing number of price reductions signals a shift towards a buyer’s market.
- Mortgage Rates: While a national factor, high rates can cool buyer demand locally, potentially shifting a seller’s market towards balance or even a buyer’s market if inventory rises.
Understanding these dynamics is crucial for both buyers and sellers to tailor their strategies effectively.
How Seasonality Affects Housing Inventory and Prices
Seasonality plays a significant, predictable role in the housing market, influencing everything from inventory levels to pricing and transaction speeds. These patterns are driven by factors like weather, school calendars, and holidays.
The peak buying season typically runs from April through June. During this period, we see a surge in activity, with an average of 16,530 existing homes sold per day nationwide. Homes tend to sell faster, with a median of 33 days on the market. Prices also reach their highest point, with homes being 16% more expensive in June compared to the winter months (December-February). This is when sellers often achieve the highest prices and fastest sales.
Activity remains high but begins to slow from July through September. As summer winds down and families settle into new routines, daily sales volume slightly decreases, and days on market may extend marginally.
The fall slowdown, from October to November, sees a noticeable dip in market activity. Existing home sales drop to around 13,810 per day, and homes stay on the market for an average of 41 days. This period often presents more opportunities for buyers, as prices can be about 5% less expensive compared to peak June values. Serious buyers, less deterred by the chill, can find motivated sellers and potentially better negotiation leverage.
Finally, the winter lull, from December through February, marks the lowest point of activity. Sales volume is at its minimum (e.g., 11,380 existing homes sold per day), and homes take the longest to sell (median 49 days). While inventory is typically lower, the buyers who are active during this time are often highly motivated, and sellers might be more open to negotiations.
These seasonal trends can vary significantly by region. For example, the Midwest experiences extreme seasonal swings; twice as many homes are sold in June (4,430 per day) compared to January (2,050 per day). In contrast, warmer climates and regions like the West tend to have less pronounced seasonal fluctuations, maintaining steadier activity year-round. New construction homes also tend to be less affected by seasonality, as they are often sold before completion and continuously enter the market.
For buyers, the late fall and winter months often offer the best opportunities for lower prices and more negotiation power. For sellers, listing in the spring and early summer typically maximizes price and speed of sale. However, serious buyers in winter might face less competition, and sellers in winter might benefit from buyers who are highly motivated.
Actionable Strategies for Homebuyers and Investors
Navigating the local real estate market successfully, whether you’re a first-time buyer or a seasoned investor, requires a strategic and informed approach. In today’s environment, where interest rates are elevated and market conditions can shift rapidly, having a clear plan is more crucial than ever.

Leveraging Hyper-Local Data When Navigating the Local Real Estate Market
While national trends provide context, the true battleground for real estate decisions is at the hyper-local level. National averages often hide significant neighborhood swings, where one block might be experiencing bidding wars while an adjacent one sees price reductions. This is why relying on hyper-local data and knowledge is paramount.
Comparative Market Analysis (CMA): This is your most powerful tool. A CMA compares a property to similar homes that have recently sold, are currently under contract, or are actively listed in the immediate area. Crucially, look for comps sold within the last 30 to 60 days, as older data may not reflect current interest rate impacts or market shifts. Online valuation tools, while a starting point, often miss physical nuances like street traffic, lot shape, renovation quality, or proximity to specific amenities. These tools use broad inputs and can’t account for the subtle differences that impact local pricing.
Municipal Open Data and Zoning Laws: Dive into your city’s open data portals. These resources can reveal invaluable information about local development plans, zoning changes, and community trends that could affect property values and demand. Understanding zoning laws, for instance, can inform you about potential future construction or restrictions that might impact your property’s long-term value.
School Boundaries and Neighborhood Micro-Markets: School district boundaries can significantly influence home values. Researching school performance and attendance zones is critical for families. Furthermore, recognize that large neighborhoods often contain smaller “micro-markets” with distinct characteristics. One side of a highway or a specific subdivision might have different demand, pricing, and amenities than another, even if they’re geographically close. Local real estate professionals, with their deep understanding of these nuances, are indispensable in interpreting this data. They can help you identify “hidden gems” or areas poised for growth that algorithms might overlook.
Common Pitfalls to Avoid When Navigating the Local Real Estate Market
Even with the best intentions, buyers and investors can fall into common traps that lead to costly mistakes. Being aware of these pitfalls can help you navigate the market more effectively.
Emotional Overpaying: In a competitive market, it’s easy to get caught up in bidding wars and pay more than a home is truly worth. Set a firm maximum price limit based on your budget and local comparable sales before entering negotiations. Stick to it. The best time to buy is when it’s financially right for you, not just when the market is hot.
Skipping Home Inspections: While tempting in a seller’s market to make your offer more attractive, waiving a home inspection is a significant risk. Approximately 15% of real estate transactions require additional negotiations or minor repairs due to issues uncovered during inspections. These issues can range from minor fixes to major structural problems, potentially costing thousands. Always include an inspection contingency, focusing on major systems and health/safety concerns in your negotiations. In regions like Las Vegas, there are 12 desert-specific failure modes (e.g., soil movement, extreme heat wear) that generalist inspectors might miss, highlighting the need for specialized expertise.
Ignoring Hidden Costs: The purchase price is just one component. Buyers must budget for closing costs (which can be 2-5% of the loan amount), property taxes, insurance, and potential HOA fees. In some areas, like Nevada, new construction homes may have Special Improvement District (SID) and Local Improvement District (LID) taxes, which are additional assessments for infrastructure that can significantly impact your annual costs. Always factor in these long-term expenses.
Appraisal Gaps: In a rapidly appreciating market, homes can sometimes appraise for less than the agreed-upon purchase price. This “appraisal gap” occurs because appraisers rely on historical sales data, which can lag behind current, fast-moving market conditions. Buyers need to be prepared to cover this gap with additional cash or negotiate with the seller.
Budget Overextension: Lenders typically look for a debt-to-income (DTI) ratio below 43% for standard mortgage programs. Exceeding this can make it harder to qualify for favorable rates or even a loan at all. Before you start looking, assess your financial readiness, secure a pre-approval, and define a “buy box” that aligns with your budget and non-negotiable needs. Aim to look for homes priced 15% to 20% below your maximum pre-approval limit to maintain financial breathing room, especially with current interest rates.
Staging, Pricing, and Incentives: A Guide for Sellers

For sellers in July 2026, navigating the market effectively means more than just putting a “For Sale” sign in the yard. With interest rates impacting buyer affordability and inventory levels fluctuating, strategic preparation, pricing, and the judicious use of incentives can significantly influence your home’s appeal and final sale price.
Curb Appeal and Professional Photography: First impressions are paramount. Enhance your home’s curb appeal with targeted landscaping, fresh paint, and minor exterior repairs. Inside, declutter, depersonalize, and consider professional staging. Neutral colors and a clean, spacious environment help buyers envision themselves living in the home. High-quality professional photography is non-negotiable; it’s the digital storefront that entices buyers to visit in person. Homes with professional photos often receive more views and sell faster.
Strategic Pricing: Overpricing your home, even in a seller’s market, can lead to it sitting on the market, eventually requiring price reductions that signal desperation. Work with your real estate agent to conduct a thorough Comparative Market Analysis (CMA). This involves looking at recently sold homes that are similar to yours in size, condition, and location. Price your home accurately to the current active buyer pool, rather than anchoring to past market peaks. Sometimes, pricing slightly below market value can generate multiple offers and drive the price up through competition. In Traverse City, for example, the average sale-to-list price ratio hovering around 100% indicates that accurate pricing is key to achieving asking price or more.
Home Valuation: While online estimates provide a baseline, a true home valuation comes from a local expert who understands micro-market nuances. They can account for unique features, recent neighborhood developments, and current buyer demand that algorithms might miss.
The Power of Seller Incentives in a Competitive Market
In a market where higher interest rates can deter buyers, strategic seller incentives have become a powerful tool to attract offers and make your home more affordable.
Rate Buydowns: A seller-funded rate buydown involves you, the seller, paying an upfront fee to temporarily or permanently lower the buyer’s interest rate. A common example is a 2-1 rate buydown, where you pay to reduce the buyer’s rate by 2% in the first year and 1% in the second year. This significantly reduces the buyer’s initial monthly payments, making your home more accessible and expanding the pool of potential buyers. For a buyer facing a 6.55% rate, a 2-1 buydown could mean a 4.55% rate in year one and 5.55% in year two, offering substantial savings.
Closing Cost Contributions: Offering to cover a portion of the buyer’s closing costs (typically 2-5% of the loan amount) can alleviate their upfront financial burden. This is especially attractive to buyers with limited cash reserves. It’s often a more impactful incentive than a small price reduction, as it directly reduces the cash needed at closing.
Home Warranties: Providing a comprehensive home warranty for the first year of ownership gives buyers peace of mind. It covers the repair or replacement of major home systems and appliances, protecting them from unexpected post-purchase expenses. This small investment can make your listing stand out.
It’s crucial to consult with your real estate agent and a loan officer when considering these incentives. There are often loan limits on how much a seller can contribute, which vary based on the buyer’s loan type (e.g., FHA, VA, Conventional). Understanding these limits ensures your incentives are both effective and compliant. By creatively using these financial tools, sellers can effectively combat the impact of higher interest rates and make their properties more appealing to a broader range of buyers.
Navigating the Rental Market and Investment Opportunities
The real estate market isn’t just about buying and selling homes; it also encompasses a dynamic rental market and a landscape of opportunities for investors. In July 2026, these segments are influenced by unique factors, offering distinct strategies for renters and those looking to build wealth through real estate.
Rental Demand: The elevated interest rate environment has pushed some prospective buyers into the rental market, sustaining demand in many urban and suburban areas. This is further supported by a projected nearly 40% drop in multifamily completions in 2026, which will minimize supply pressure and help stabilize rental occupancy rates above 90% in many markets. This sustained demand makes renting a viable, and sometimes necessary, option for many.
Property Management: For landlords and investors, effective property management is key to maximizing returns. This includes thorough tenant screening, proactive maintenance coordination, and transparent financial reporting. Professional property managers can bridge the gap between landlord responsibilities and tenant satisfaction, ensuring reliable, long-term tenants and minimizing vacancies.
Tenant Screening: A robust tenant screening process is essential to secure responsible renters, reducing the risk of property damage or late payments. This typically involves background checks, credit checks, and employment verification.
Cash Flow Analysis: Investors must conduct rigorous cash flow analysis, especially with current interest rates. This means carefully calculating potential rental income against all expenses, including mortgage payments, property taxes, insurance, maintenance, and vacancy rates.
Out-of-State Investing: With affordability constraints in high-cost coastal markets, many investors are looking to out-of-state opportunities. Regions like the Midwest offer lower barriers to entry, stable rental yields, and attractive rent-to-price ratios, making them appealing for cash flow.
Finding Value in Modern Apartment Living Spaces
For renters, the search for a new home involves balancing cost, location, and lifestyle. Modern apartment living spaces have become increasingly popular, particularly in urban and mixed-use environments, offering a blend of convenience and amenities.
Urban Density and Lifestyle Amenities: Many modern apartment complexes are strategically located in areas with high urban density, providing easy access to work, entertainment, and public transportation. These properties often boast a range of lifestyle amenities such as fitness centers, co-working spaces, communal lounges, and even pet-friendly facilities, catering to a diverse demographic seeking convenience and community. Exploring options like those offered by modern apartment living spaces can provide a fulfilling rental experience.
Lease Negotiations: Renters should be prepared to negotiate lease terms, especially in areas with increasing inventory. This could include asking for a slightly lower monthly rent, a longer lease term for stability, or specific amenities. Understanding local rental market trends—average rents for similar units, vacancy rates, and landlord incentives—can strengthen your negotiating position.
Cost of Living: When evaluating rental options, always consider the total cost of living in the area, not just the rent. This includes utilities, transportation costs, groceries, and local taxes. For example, while Traverse City’s cost of living is 8% below the national average, it’s 2% above the Michigan state average, highlighting the importance of localized budgeting.
How Investors Can Find Deals and Maximize Returns
The July 2026 market presents unique avenues for real estate investors to find deals and maximize returns, particularly by looking beyond traditional hot spots and leveraging strategic financing.
The Midwest Advantage: As capital flees high-cost coastal bottlenecks, stable Midwest markets are gaining momentum. States like Missouri (average home value $280,000), Indiana ($250,000), and Ohio ($260,000) offer lower entry points and often still allow investors to achieve the 1% rule (where monthly rent equals 1% of the purchase price), indicating strong cash flow potential. This makes them attractive for out-of-state investors seeking higher yields.
DSCR Loans: For self-employed individuals or entrepreneurs, traditional financing can be challenging. Debt Service Coverage Ratio (DSCR) loans are a type of Non-QM (Non-Qualified Mortgage) product that allows investors to qualify based on the property’s cash flow rather than personal income. This opens up opportunities for those who might not meet conventional loan criteria.
BRRRR Method Optimization: The “Buy, Rehab, Rent, Refinance, Repeat” (BRRRR) strategy remains effective, but in a high-interest environment, optimizing rehab times is crucial. Minimizing renovation periods to under 45 days can significantly reduce holding costs and accelerate your path to refinancing.
Multifamily Supply Trends: The forecast 40% drop in multifamily completions in 2026 suggests that existing rental properties will face less new competition, supporting stable occupancy rates and potentially allowing for moderate rent increases. Investors in this sector may find sustained demand for their properties.
Seller Concessions and Rate Buydowns: Even investors can benefit from the buyer leverage seen in some markets. Negotiating for seller concessions, including contributions to closing costs or even seller-funded rate buydowns, can significantly improve your initial cash outlay and overall return on investment.
Frequently Asked Questions
To further clarify common concerns, we’ve addressed some key questions about navigating the local real estate market in July 2026.
How do interest rates impact buyer affordability?
Interest rates have a direct and significant impact on buyer affordability. Higher interest rates translate to higher monthly mortgage payments, even if the home price remains the same. For example, a difference of just one percentage point in a mortgage rate can add hundreds of dollars to a monthly payment, potentially pricing some buyers out of their desired home or neighborhood. This reduces overall purchasing power, can deter potential buyers, and may lead to homes sitting on the market longer. Buyers can explore rate lock options to secure a rate for a period while they search for a home, and some lenders offer “float down” options if rates drop before closing.
What is a seller-funded rate buydown?
A seller-funded rate buydown is a financial incentive offered by the seller to make their home more affordable for the buyer. The seller pays an upfront fee to the lender, which in turn temporarily or permanently lowers the buyer’s interest rate. A common structure is a “2-1 buydown,” where the buyer’s interest rate is reduced by 2% in the first year and 1% in the second year, before reverting to the original rate. This provides significant relief on monthly payments during the initial years of homeownership, making the property more attractive to buyers who might otherwise be stretched thin by current interest rates.
Why do automated online valuation tools sometimes miss the mark?
Automated online valuation tools (AVMs) like those found on popular real estate websites provide a convenient starting point for understanding property values, but they often miss the mark due to their reliance on broad inputs and historical data. These tools cannot account for crucial physical nuances and hyper-local factors such as:
- Street noise or traffic patterns: A home on a busy street will typically be valued differently than an identical home on a quiet cul-de-sac.
- Lot slope or shape: Irregular or steeply sloped lots can impact usability and value.
- Renovation quality and specific upgrades: AVMs might not differentiate between a high-end kitchen remodel and a basic update.
- Proximity to specific amenities or nuisances: Being next to a park versus a commercial zone can alter value.
- Micro-market trends: AVMs struggle to capture block-by-block market shifts or localized demand.
The National Association of Realtors (NAR) emphasizes that while AVMs offer a baseline, they cannot replace the nuanced insights of a local real estate professional who understands the unique characteristics of a neighborhood and can perform a detailed comparative market analysis.
Conclusion
Navigating the local real estate market in July 2026 demands a sophisticated understanding of both national trends and hyper-local dynamics. Whether you are buying, selling, or renting, success hinges on informed decision-making, strategic planning, and leveraging the right resources. We’ve seen how interest rates and affordability shape the landscape, the critical differences between buyer’s and seller’s markets, and the seasonal rhythms that influence inventory and pricing.
For buyers, this means securing pre-approval, defining your “buy box,” and utilizing hyper-local data to avoid pitfalls like emotional overpaying or ignoring hidden costs. For sellers, it involves meticulous preparation, strategic pricing, and the smart application of incentives like rate buydowns to attract qualified buyers. Renters, too, benefit from understanding local market conditions and leveraging modern apartment living spaces that offer lifestyle amenities and value. Investors can find opportunities by focusing on cash flow, exploring markets like the Midwest, and utilizing specialized financing.
The key to navigating this complex environment is to arm yourself with knowledge and partner with local experts who can provide tailored guidance. By focusing on your specific local market and making data-driven choices, you can approach your real estate goals with confidence and clarity.
